After work, I was scrolling through a brokerage report when I stopped cold. Since the new government took office, Daewoo E&C's market cap surged 674%, Samsung C&T 178%, Hyundai E&C 158%. Over the same period, Q1 earnings went the other way — Hyundai E&C's operating profit fell 15.4% year-over-year, Samsung C&T reflected massive provisions. Stock prices are screaming golden age while earnings are pointing to a slump. One of them is lying. So I went back to the data to revisit what exactly "the construction golden age" means.
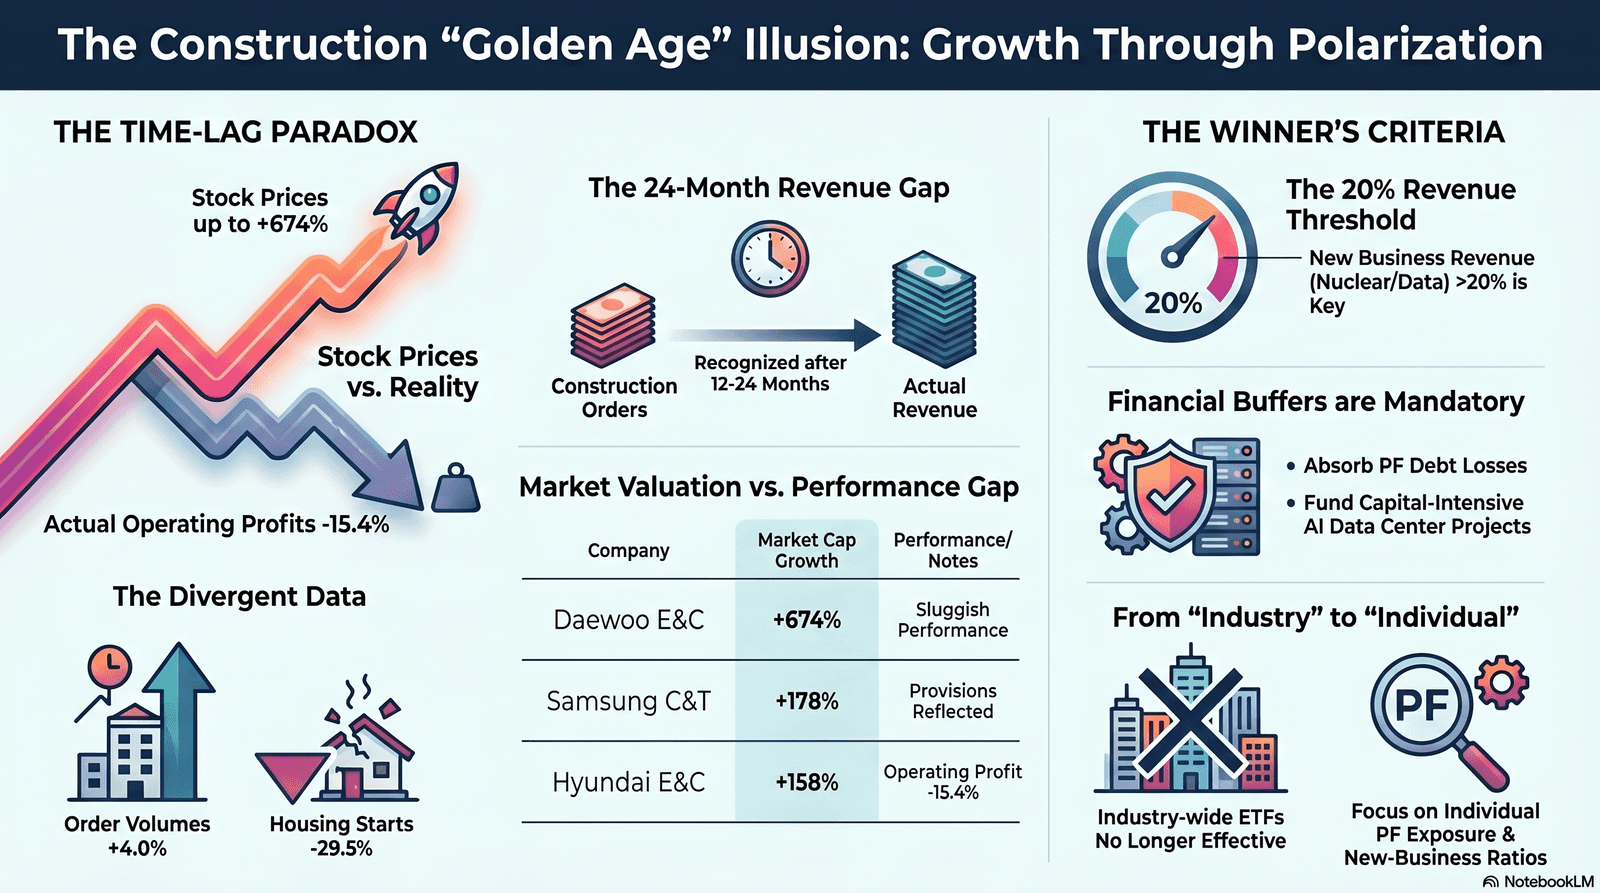
Recovery vs. Recession — Same Data, Different Conclusions
Let's start with the facts. The Korea Institute of Construction Industry Research projected 2026 construction orders at ₩231.2 trillion, up 4.0% year-over-year, and construction investment at ₩270 trillion, up 2.0%. The Ministry of Land, Infrastructure and Transport raised the SOC budget 8.2% to ₩21.1 trillion. Meanwhile, cumulative building starts from January to August 2025 fell 16.0% year-over-year, with residential starts down 29.5%. Recovery advocates look at orders and budgets. Recession advocates look at starts and earnings.
This looks like a difference of opinion. It's actually two people reading different clocks. Construction takes 12 to 24 months for orders to be recognized as revenue. The decline in construction starts from 2024–2025 is now flowing into 2026 earnings. So even as new order indicators improve, revenue indicators deteriorate. That's why both sides can be right simultaneously — they're not arguing, they're looking at different time horizons.
Investors who don't understand this structure panic at every quarterly earnings release. The pattern repeats: buy on backlog news, stop-loss on an earnings shock. The first thing to accept is that through 2026 and into early 2027, we're in an asymmetric window where "orders improve while earnings worsen."
The Revenue Timeline for Data Centers and Nuclear Power
The numbers on new businesses are significant. JLL projected global data center market growth at 14% CAGR through 2030. McKinsey estimated $6.7 trillion in infrastructure investment needed through 2030. On nuclear, NH Investment Securities analyst Lee Eun-sang projected Korea's top five construction firms could capture ₩30 trillion annually in overseas nuclear orders through 2040 — equal to Korea's average annual overseas contract volume of $30 billion, and that market opens anew every year.
One trap here: orders and revenue are different variables. A data center takes 2–3 years from award to completion; a nuclear plant takes 7–10 years. New business order announcements carry another long lag before hitting P&L. But stock prices react instantly to order announcements. Daewoo E&C's market cap more than sextupling since the new government reflects the possibility of a Vietnam nuclear contract and a "Team Korea" construction partner role — not improvement in current earnings. Stock prices feed on expectations; earnings feed on time.
When you see new business order news, it helps to have one standard: focus not on the order announcement itself but on when new business revenue share reaches a meaningful level. Currently, data centers, nuclear, and overseas infrastructure represent roughly high single digits to low double digits as a share of major construction company revenue. When this reliably crosses 20%, that's when genuine structural transition begins. Until then, stock price gains are pricing in expectations — and when those expectations slip even once, a correction follows.
Financial Buffers Will Save Some and Sink Others
A third variable enters here: whether companies can absorb PF contingent liabilities and unsold unit losses while simultaneously securing equity for new business investment. All three major Korean credit rating agencies — Korea Ratings, NICE Ratings, Korea Credit Rating — projected continued downgrade pressure on construction companies through 2026, flagging mid-tier firms with high regional unsold unit exposure or weak liquidity as monitoring targets. Bankruptcy filings among construction companies ranked in the top 100 by construction capacity continued throughout 2025.
The problem is that new businesses are capital-intensive. A standard hyperscale AI data center project finances roughly 30% with equity and 70% through PF. Pure construction contracting generates thin margins; real profitability requires becoming a developer and operator. That's why GS E&C is moving into operations through subsidiary DC Bridge, and DL E&C is expanding into commissioning. But doing this requires capital. Companies whose buffers have been eroded by time-lag losses can't capture opportunities even when they arrive.
The industry ultimately splits in two: companies that absorb time-lag losses and deploy remaining capital into new business share capture — versus companies that lose both to time-lag losses and miss the new business wave. Industry average metrics become increasingly meaningless. Sector ETFs are not the answer; this is a phase where you need to separately track each company's new business revenue share trajectory and PF exposure reduction speed. The golden age arrives at the company level, not the industry level.
What to Worry About — and What to Ignore
Ranking risks by priority: at the top goes the time-lag loss itself. The 2024–2025 construction starts decline materializes as 2026–2027 revenue. That means earnings shock potential is alive at every quarterly release. For stocks already up 100–600%, the moment earnings fall short of expectations, volatility opens wide. Regional unsold units and ongoing non-recurring PF losses sit in the same tier — the rating agencies have named this scenario explicitly.
The middle tier holds interest rate and FX volatility, construction cost changes, safety regulation tightening, Czech and Vietnam nuclear negotiation delays, and data center bubble concerns. Worth monitoring, but not calling for immediate repositioning. Safety regulation tightening actually raises barriers for smaller firms and lifts large firm market share. Nuclear negotiation delays are timeline issues, not cancellation issues — short-term price shocks could become buying windows.
At the bottom, the scenario that's essentially unlikely: a "full industry supercycle." The polarization dynamic means an average trend in one direction doesn't hold when the industry is splitting in two. A 2010s-style systemic PF crisis is also low probability — CR REITs and refinancing structures are functioning, and large firm PF exposure has been substantially cleared. "Permanent death of the housing business" is equally unlikely. Prime metropolitan locations still see hundreds-to-one subscription ratios due to price cap policy effects. Housing isn't disappearing — it's polarizing.
The Time to Look at Companies, Not the Industry
Ultimately, "the construction golden age" is wrong at the industry level and right at the company level. It's not that construction as a whole is reviving. Only a small number of large firms — those simultaneously building financial buffers to absorb time-lag losses and growing new business revenue share — will own the next cycle. The metric investors need to watch isn't total construction industry order volume; it's each individual company's new business revenue share trajectory and PF exposure reduction pace. Whether the stocks already up 600% are companies that will live through the golden age, or companies that simply front-loaded expectations — the next two or three quarterly earnings releases will slowly reveal the answer.
This article is for informational purposes only and does not constitute a recommendation to buy or sell any specific security. All investment decisions and their outcomes are the sole responsibility of the investor.