These days, everyone around me asks whether they should buy "AI stocks" — companies using ChatGPT, AI platform businesses, domestic AI solution providers. But when you dig in, it's hard to tell where the actual profits are going. So I took a roundabout approach: looking historically at who actually captured value when a technology boom arrived. The answer turned out to be more consistent than I expected.
What the Gold Rush Maxim Really Means — The Conditions for a Winning "Pickaxe"
There's a saying: "In a gold rush, sell pickaxes, not gold." It gets quoted as investment wisdom constantly, but it isn't always right.
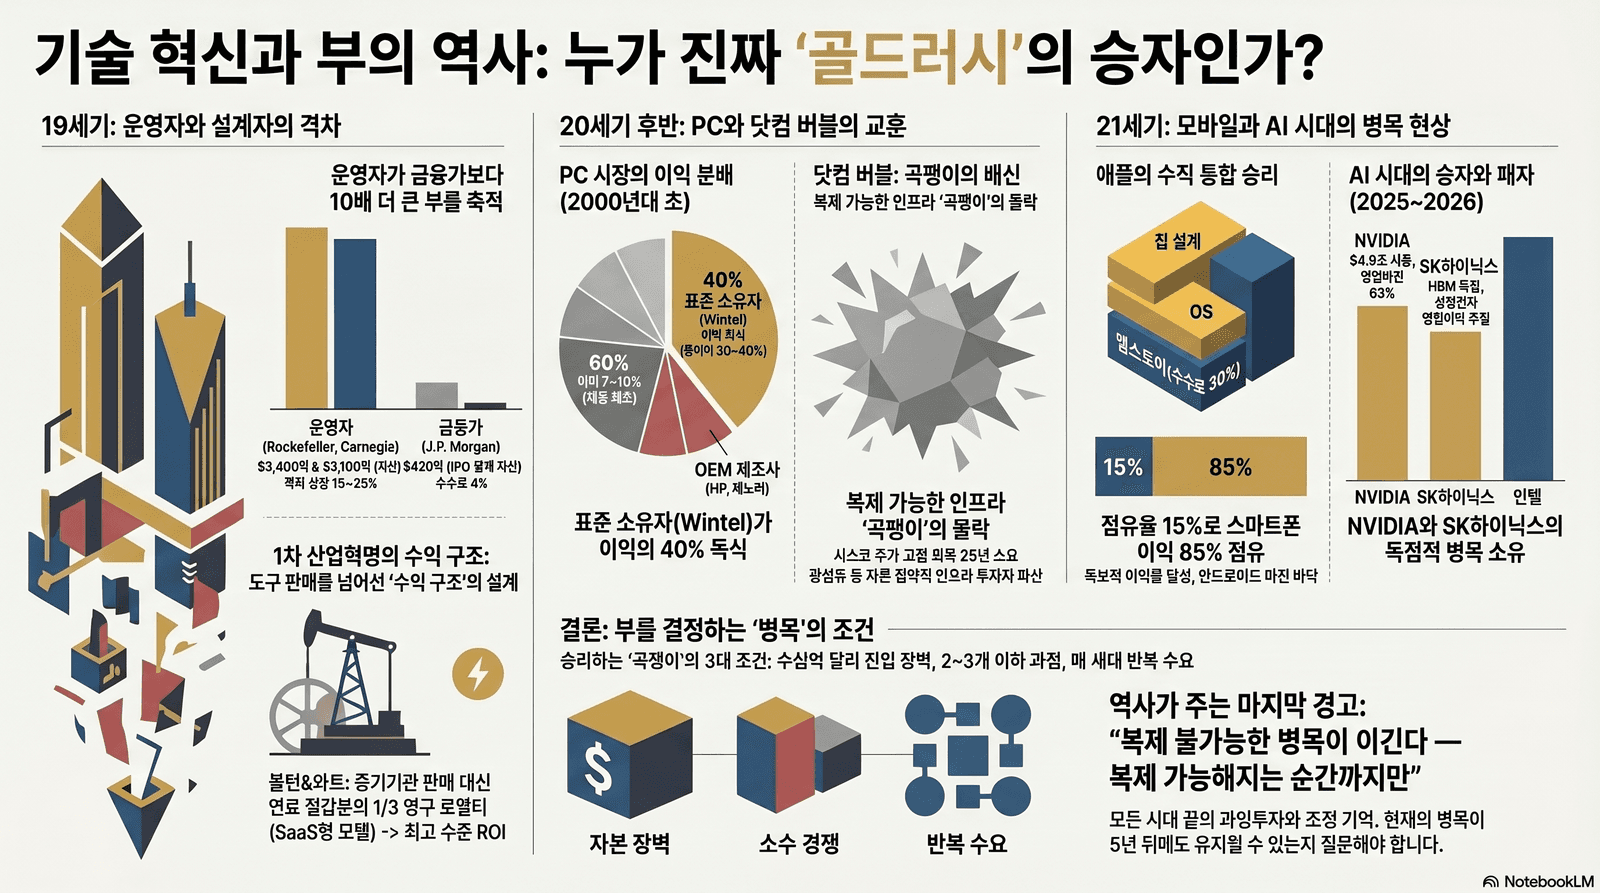
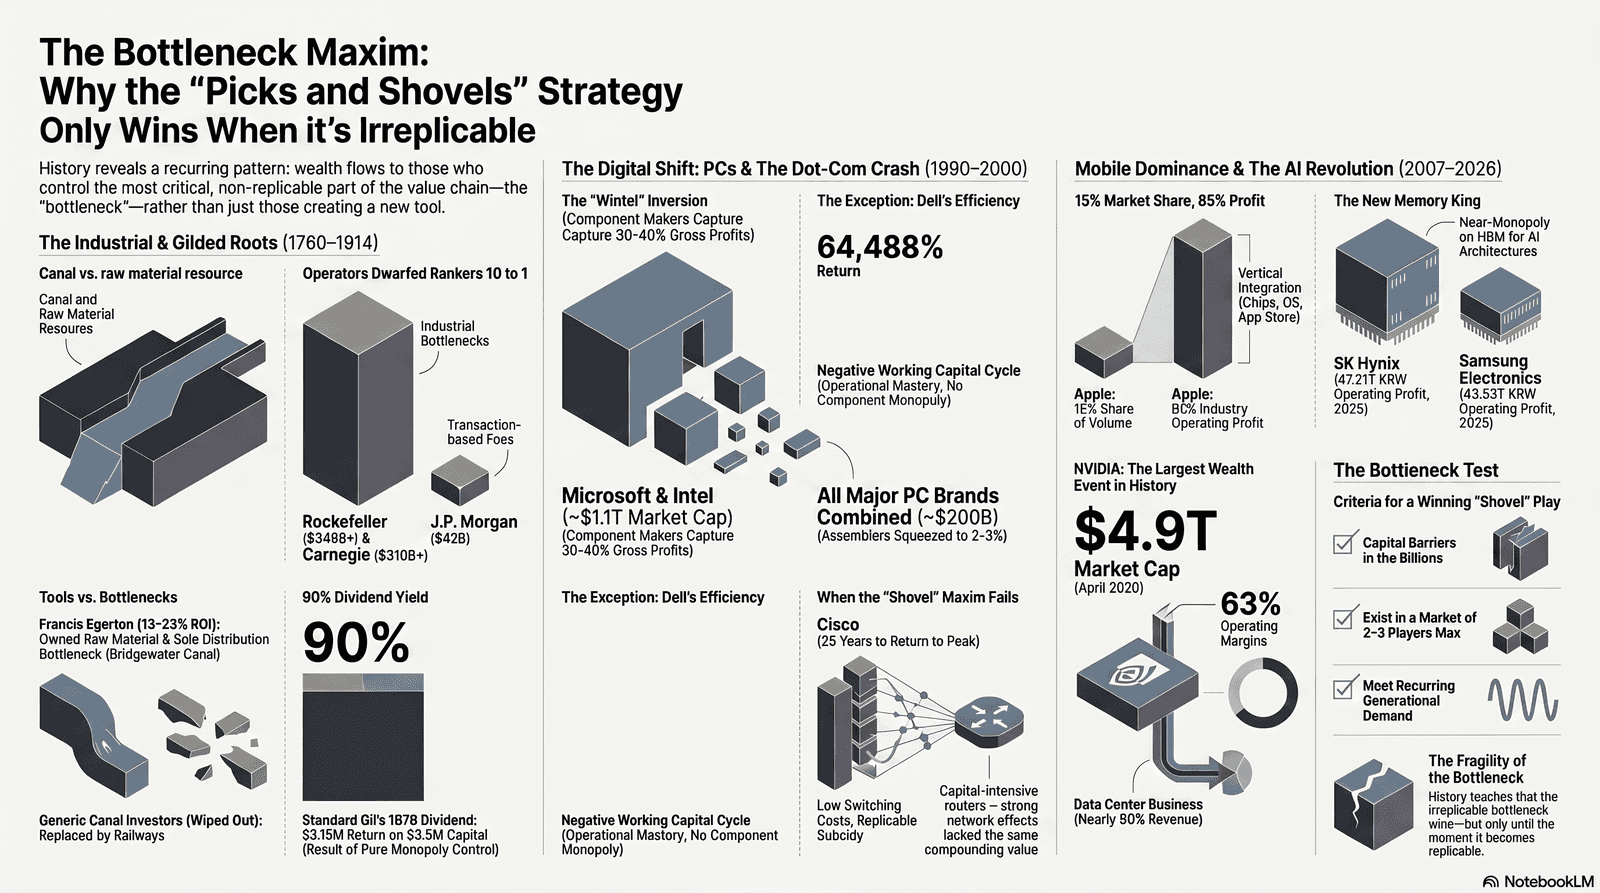
During the First Industrial Revolution, Francis Egerton — who owned the Bridgewater Canal — combined coal ownership with sole transport control, earning an average annual ROI of 13–23%. The key wasn't that he sold "tools." He owned the coal and the only route to move it.
Meanwhile, Boulton & Watt, who held the steam engine patent, didn't sell machines — they structured deals to collect a perpetual royalty equal to one-third of fuel savings. A SaaS subscription model, a century before the term existed. Their ROI beat everyone.
The losers of that era were canal investors. When the Liverpool–Manchester Railway opened in 1830, canal stocks dropped 50–75%. The "pickaxe" — the canal — had been replaced by a better pickaxe.
The conclusion: a pickaxe only wins when it is structurally irreplicable.
The Gilded Age Shock — Operators Earned 10x More Than the Banker Who Designed Their Deals
The most striking data point from America's Gilded Age (1870–1914):
Rockefeller's inflation-adjusted wealth reached $340–500 billion. Carnegie: $310–372 billion. Vanderbilt: $185–275 billion. J.P. Morgan: $42 billion.
Morgan designed the US Steel IPO and pocketed nearly $60 million in fees — yet ended up with one-tenth the wealth of the operators who sold the steel and compounded the capital. Morgan earned 4% per transaction; the operators compounded their underlying capital at 15–25% annually.
This pattern repeats across every era. Financiers design deals and collect fees, but operators who own the bottleneck take the real wealth over time.
Standard Oil's 1879 dividend yield was 90% — $3.15 million paid on $3.5 million of capital. That's not shareholder returns. That's what monopoly looks like in the numbers.
The PC Revolution — The First Era When Components Were Worth More Than Finished Products
Something strange happened in the late 1990s PC market. Two component makers had market caps that dwarfed the dozens of companies assembling and selling finished machines.
In August 2000: Intel at $509 billion, Microsoft at $615 billion. The combined market cap of major PC brands (Compaq, Dell, HP, Gateway, IBM) was roughly $150–200 billion — despite far higher revenues.
An MIT/UC Irvine research team dissected the profit on a single laptop: Microsoft and Intel together captured 30–40% of total profit. OEMs (HP, Lenovo): 7–10%. Taiwanese ODM assemblers: 2–3%. The people actually building the machines captured the least.
IBM invented the PC standard and sold the ThinkPad line to Lenovo for $1.75 billion in 2004. Compaq was the world's top PC maker before being absorbed by HP. Manufacturers who didn't own the standard consistently ended the same way.
Dell is the fascinating outlier. Operating margins were only 5–8%, yet from IPO in 1988 to 2000, it returned 64,488% — roughly 97% annually. When negative working capital cycles (cash arrives before inventory costs) combine with volume explosion, even a low-margin business can produce a generational stock.
The Dot-Com Bubble — The Era That Directly Broke the "Pickaxe" Maxim
Cisco's stock price from its March 2000 peak wasn't recovered until December 2025 — 25 years later. The S&P 500 was up 350% in the same period.
People who invested in internet infrastructure because "sell pickaxes in a gold rush" suffered catastrophic results. WorldCom collapsed from a $150 billion market cap to near-zero. Global Crossing went bankrupt with 95% of its laid fiber sitting dark. Global telecom stocks lost over $2 trillion between 2000 and 2002.
Meanwhile, the "risky" application layer moved the opposite direction. Priceline (now Booking) returned 147x from its 2002 bottom over 11 years. Amazon: 200,000%+ from IPO. Google: 7x in 6 years after its 2004 IPO (roughly 40% annually).
Why did pickaxes lose this time? Because fiber optic cables and routers were replicable, capital-intensive infrastructure. $500 billion in bonds flowed into telecom from 1996 to 2001, flooding supply. A router is just a router — no switching costs, no network effects.
Cisco's 39x price-to-sales ratio had already priced in every conceivable future. In the end, infrastructure shareholders' losses became a 20-year subsidy for consumers and application-layer companies.
The Mobile Era — How 15% Market Share Captured 85% of Profits
Apple held only 15–20% of the smartphone market but consistently captured 60–90% of the entire industry's operating profit. In 2022, the figure was 85%.
The mechanism was vertical integration. Apple designed its own A-series chips, controlled iOS, and took a 30% App Store commission. By 2020, developers had collectively received $200 billion through the App Store — Apple's cut: $85 billion+. Gross margins: 75%.
The Android camp was different. Pay Qualcomm for chips, pay Google royalties, pay Samsung for displays, while Chinese OEMs drove prices toward zero, compressing margins at every layer.
TSMC's success as the picks-and-shovels play of this era was also clearly structural: a new fab costs $20+ billion, making the entry barrier enormous. Effective competitors are limited to Samsung. Every chip generation requires the latest node, locking in structural repeat demand. Market cap went from $63 billion in 2010 to $565 billion in 2020 — 9x in a decade.
Nokia went from $250 billion to $19 billion in market cap over the same period and sold its handset business to Microsoft, which then wrote the entire acquisition down to zero.
The AI Era — The First Time "Components" Won on Every Metric
As of April 2026, NVIDIA's market cap stands at approximately $4.9 trillion. From $300 billion at the end of 2020 to $4.9 trillion in 5.5 years — the largest single-company wealth creation in history.
Operating margin: 63%. Gross margin: 71%. Data center accounts for 89.8% of total revenue.
What differentiates this from Cisco in the dot-com bubble: earnings are actually following. FY2026 revenue of $215.9 billion with operating income of $137.3 billion. The P/E ratio isn't extreme — the decisive contrast with Cisco's 39x price-to-sales in 2000.
SK Hynix is another unavoidable story. Its 2025 operating profit reached 47.21 trillion won, surpassing Samsung Electronics (43.53 trillion won) for the first time ever. A Q4 operating margin of 58% is the highest in memory upcycle history. The structure: near-exclusive HBM supply to NVIDIA's Blackwell and Rubin platforms.
Intel, meanwhile, shrank from $300 billion in market cap at the start of 2020 to $85 billion by end of 2024. Down 60% in 2024 alone — the worst year in its 53-year listing history. Replaced by NVIDIA in the Dow Jones index.
Rare earths are a different story. The REMX ETF returned +65% in 2020, +80% in 2021, then -31%, -19%, -35% over the following three years, spiking to +93% in 2025. MP Materials posted a net loss of $86 million in 2025. The stock moves on Defense Department investments and onshoring policy, not fundamental earnings. Useful as a hedge, but too structurally unstable to anchor a portfolio.
One Question Across 10 Eras
After organizing ten eras of data, the pattern is clear.
The top wealth creators were almost always vertically integrated primary producers: Rockefeller, Carnegie, Ford, Apple, NVIDIA. The sandwiched middle layers — assemblers, refiners, set makers — almost always lost. Raw material suppliers that couldn't vertically integrate structurally lost. US Steel, once America's largest company, posted negative real returns over 120 years.
The eras where picks-and-shovels won all satisfied the same three conditions: capital entry barriers in the billions, two to three competitors or fewer, and structural repeat demand every generation. Cisco failed to meet these conditions. TSMC and ASML pass all three.
Final Thought
Ten eras of history boil down to one insight: ask not "who builds it?" but "who owns the irreplicable bottleneck?"
The same question applies to AI stocks. Is what this company owns replicable? Could a competitor build something similar in five years? The answer should determine the size of your position.
One more thing worth holding onto: every era ended with overinvestment and correction. NVIDIA owns today's bottleneck — but bottlenecks don't last forever. The real lesson from history isn't "picks-and-shovels win." It's: "irreplicable bottlenecks win — until they become replicable."
It might be worth counting how many companies in your portfolio actually own one.
This post is for informational purposes only and does not constitute a recommendation to buy or sell any specific security. All investment decisions and their outcomes remain the sole responsibility of the investor.